NIFTY 50 IDEA FOR INTRDAY 15TH APRIL 2021NIFTY 50 IDEA FOR INTRDAY 15TH APRIL 2021NIFTY 50 IDEA FOR INTRDAY 15TH APRIL 2021NIFTY 50 IDEA FOR INTRDAY 15TH APRIL 2021NIFTY 50 IDEA FOR INTRDAY 15TH APRIL 2021NIFTY 50 IDEA FOR INTRDAY 15TH APRIL 2021NIFTY 50 IDEA FOR INTRDAY 15TH APRIL 2021NIFTY 50 IDEA FOR INTRDAY 15TH APRIL 2021NIFTY 50 IDEA FOR INTRDAY 15TH APRIL 2021NIFTY 50 IDEA FOR INTRDAY 15TH APRIL 2021NIFTY 50 IDEA FOR INTRDAY 15TH APRIL 2021NIFTY 50 IDEA FOR INTRDAY 15TH APRIL 2021NIFTY 50 IDEA FOR INTRDAY 15TH APRIL 2021NIFTY 50 IDEA FOR INTRDAY 15TH APRIL 2021NIFTY 50 IDEA FOR INTRDAY 15TH APRIL 2021NIFTY 50 IDEA FOR INTRDAY 15TH APRIL 2021NIFTY 50 IDEA FOR INTRDAY 15TH APRIL 2021NIFTY 50 IDEA FOR INTRDAY 15TH APRIL 2021NIFTY 50 IDEA FOR INTRDAY 15TH APRIL 2021NIFTY 50 IDEA FOR INTRDAY 15TH APRIL 2021NIFTY 50 IDEA FOR INTRDAY 15TH APRIL 2021NIFTY 50 IDEA FOR INTRDAY 15TH APRIL 2021NIFTY 50 IDEA FOR INTRDAY 15TH APRIL 2021NIFTY 50 IDEA FOR INTRDAY 15TH APRIL 2021NIFTY 50 IDEA FOR INTRDAY 15TH APRIL 2021NIFTY 50 IDEA FOR INTRDAY 15TH APRIL 2021NIFTY 50 IDEA FOR INTRDAY 15TH APRIL 2021NIFTY 50 IDEA FOR INTRDAY 15TH APRIL 2021NIFTY 50 IDEA FOR INTRDAY 15TH APRIL 2021NIFTY 50 IDEA FOR INTRDAY 15TH APRIL 2021NIFTY 50 IDEA FOR INTRDAY 15TH APRIL 2021NIFTY 50 IDEA FOR INTRDAY 15TH APRIL 2021NIFTY 50 IDEA FOR INTRDAY 15TH APRIL 2021NIFTY 50 IDEA FOR INTRDAY 15TH APRIL 2021NIFTY 50 IDEA FOR INTRDAY 15TH APRIL 2021NIFTY 50 IDEA FOR INTRDAY 15TH APRIL 2021NIFTY 50 IDEA FOR INTRDAY 15TH APRIL 2021NIFTY 50 IDEA FOR INTRDAY 15TH APRIL 2021
Search in ideas for "NIFTY 50"

Technical Analysis Report for the NIFTY 50 INDEX.# NIFTY 50 Technical Analysis: Comprehensive Multi-Timeframe Trading Strategy
Executive Summary
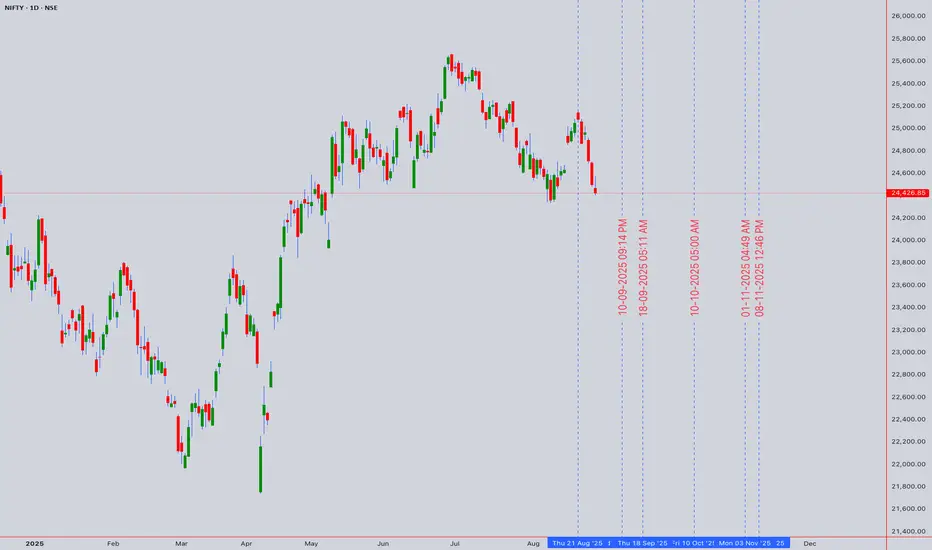
Current Price: 24,433.65 (August 29, 2025, 1:5 PM UTC+4)
Market Sentiment: Cautiously Bullish with Consolidation Bias
Primary Trend: Uptrend with potential for continued advancement
Key Resistance: 25,000 (psychological level and technical confluence)
The NIFTY 50 continues to demonstrate resilience in the face of global uncertainties, maintaining its position above key support levels while approaching significant psychological resistance. The index benefits from accommodative monetary policy with the RBI's recent rate cuts and strong domestic fundamentals, though valuations warrant selective positioning.
Market Context & Fundamental Backdrop
Monetary Policy Environment
The Reserve Bank of India has cut its repo rate by 0.25%, which now stands at 6.25%, marking a significant shift in policy stance. Markets expect the RBI may implement one more 25-bps rate cut in August 2025, especially ahead of the festive season which historically shows multiplier effects on consumer demand.
Economic Fundamentals
India's GDP expanded 7.80 percent in the second quarter of 2025 over the same quarter of the previous year, demonstrating robust economic growth. The RBI expects real GDP to grow 6.5% in FY 2025-26, supported by strong domestic demand and government capital expenditures.
Inflation and Growth Balance
Headline inflation in India is expected to average 4.2% year-on-year in the 2025 calendar year, with food inflation at 4.6% — much lower than estimates of 7%-plus for 2024, thanks to adequate rainfall and good sowing.
Earnings Outlook
Consensus expects 11-12% earnings growth for the Nifty 50 in FY26, with the index trading below 20x price-earnings on FY26 estimates, suggesting reasonable valuations at current levels.
Technical Analysis Framework
Japanese Candlestick Analysis
Weekly Pattern: Spinning top formation indicating indecision at current levels
Daily Pattern: Small-bodied candles with narrow ranges suggesting consolidation
Intraday Patterns: Hammer and doji formations prevalent in 1H and 4H timeframes
Volume Confirmation: Average volume during consolidation phase
Elliott Wave Analysis
Primary Wave Count:
Major Degree: Wave 5 of larger bull market cycle potentially in progress
Intermediate Degree: Subwave 3 of 5 showing extension characteristics
Minor Degree: Currently in subwave 4 correction of intermediate wave 3
Alternative Count: Complex correction (WXY) completion targeting 25,200-25,500
Critical Support: Wave 4 support at 23,800-24,000 maintains bullish structure
Harmonic Pattern Analysis
Active Patterns:
Bullish Gartley: Potential completion zone at 23,950-24,100
ABCD Pattern: Current formation targeting 24,800-25,000
Potential Cypher: Formation developing with D point near 25,100
Fibonacci Analysis:
- 50% retracement of major swing: 24,200
- 38.2% retracement: 24,500 (current consolidation area)
- 1.618 extension target: 24,900-25,000
Wyckoff Method Analysis
Phase Assessment: Accumulation Phase C - Testing supply
Characteristics:
- Volume patterns showing accumulation on weakness
- Price holding above composite operator accumulation zone
- Sign of Strength (SOS) evident on recent advances
Distribution Risk: Monitor for climactic volume above 25,000
W.D. Gann Technical Analysis
# Square of 9 Application
Current Position: 24,433.65 = 156.31° on the Gann wheel
Key Resistance Levels:
- 24,481 (156.5°) - immediate minor resistance
- 24,649 (157°) - intermediate resistance
- 25,000 (158.11°) - major psychological and geometric resistance
Support Levels:
- 24,336 (156°) - immediate support
- 24,025 (155°) - strong support zone
- 23,716 (154°) - major support level
# Time Theory Application
Critical Time Windows:
- September 9-12: 45-degree time angle from recent high
- September 23: Autumn equinox - natural market turning point
- October 8-15: 90-degree time cycle completion
# Price and Time Squaring
Square Root Analysis: √24,433.65 = 156.31
Next Square Levels:
- 157² = 24,649 (key resistance)
- 158² = 24,964 (approaching 25,000)
- 160² = 25,600 (extended target)
Ichimoku Kinko Hyo Analysis
Cloud Configuration:
Tenkan-sen (9): 24,445 - Price slightly below, neutral
Kijun-sen (26): 24,380 - Price above, mild bullish bias
Senkou Span A: 24,412 (cloud top)
Senkou Span B: 24,100 (cloud bottom)
Assessment: Price trading within cloud, indicating consolidation phase with neutral bias pending breakout direction.
Multi-Timeframe Technical Indicator Analysis
5-Minute Chart (Scalping Focus)
RSI(14): 49.2 - Neutral territory with no momentum bias
VWAP: 24,428 - Price oscillating around VWAP
Bollinger Bands: Middle band at 24,430, bands contracting (low volatility period)
Moving Averages: EMA(20) = 24,435, SMA(20) = 24,440
15-Minute Chart (Scalping Focus)
MACD: Near zero line, histogram flat - no clear momentum
Stochastic(14,3,3): 52.1 in neutral zone
Williams %R: -48% indicating no extreme conditions
Volume: Below average, typical for consolidation
Key Intraday Levels:
Resistance: 24,460, 24,490, 24,520
Support: 24,400, 24,370, 24,340
1-Hour Chart (Day Trading)
RSI(14): 54.3 - Slight bullish bias but not overbought
VWAP: 24,415 providing dynamic support
ADX(14): 22.1 indicating weak trend strength (consolidation)
Volume Profile: High volume node at 24,380-24,450
Trading Range:
Upper Boundary: 24,520-24,550
Lower Boundary: 24,320-24,350
Breakout Levels: Above 24,580 (bullish) / Below 24,280 (bearish)
4-Hour Chart (Swing Trading)
RSI(14): 57.8 showing mild bullish momentum
MACD: Positive but flattening, momentum slowing
Bollinger Bands: Price near middle band, bands parallel (range-bound)
Moving Averages: All short-term MAs converging around current price
Swing Levels:
Primary Resistance: 24,650-24,700
Secondary Resistance: 24,900-25,000
Primary Support: 24,200-24,250
Secondary Support: 24,000-24,050
Daily Chart (Position Trading)
RSI(14): 59.4 in bullish territory but not extreme
MACD: Positive with slight bullish divergence
Volume: Consolidation pattern with below-average volume
Pattern: Symmetrical triangle formation approaching apex
Key Daily Levels:
Triangle Resistance: 24,700-24,750 (declining)
Triangle Support: 24,150-24,200 (rising)
Breakout Targets: 25,200 (upside) / 23,600 (downside)
Weekly Chart (Long-term Analysis)
RSI(14): 63.2 showing healthy bullish momentum
MACD: Positive momentum but rate of change slowing
Long-term Trend: Intact uptrend since March 2020 low
Major Resistance: 25,000-25,200 zone
Monthly Chart (Strategic Perspective)
RSI(14): 68.1 approaching overbought levels
Long-term Pattern: Multi-year ascending triangle completion
Major Support: 22,000-22,500 zone
Extended Targets: 26,000-27,000 on sustained breakout
Comprehensive Support and Resistance Analysis
Primary Support Zones
1. 24,380-24,420: Kijun-sen and VWAP confluence zone
2. 24,320-24,350: Previous consolidation low and volume support
3. 24,200-24,250: 50% Fibonacci retracement and psychological level
4. 24,100-24,150: Cloud bottom and structural support
5. 24,000-24,050: Major psychological level and trend line support
6. 23,800-23,900: Elliott Wave 4 support and major trend line
7. 23,600-23,700: Extended support and breakout failure target
Primary Resistance Zones
1. 24,460-24,490: Immediate intraday resistance
2. 24,520-24,580: Short-term resistance and breakout level
3. 24,650-24,700: Triangle resistance and swing high
4. 24,850-24,900: Intermediate resistance zone
5. 24,950-25,000: Major psychological resistance and Square of 9
6. 25,100-25,200: Extended targets and measured moves
7. 25,500-25,800: Long-term bull market targets
Weekly Trading Strategy (September 2-6, 2025)
Monday, September 2, 2025
Market Environment: Post-weekend consolidation, range-bound expected
Primary Strategy: Range trading within established boundaries
Volatility: Low to moderate, typical Monday characteristics
Intraday Setup:
Range: 24,380-24,480
Long Entry: 24,390-24,410
- Stop Loss: 24,360
- Target 1: 24,450 (1:1.5 R/R)
- Target 2: 24,480 (1:2.5 R/R)
Short Entry: 24,470-24,490
- Stop Loss: 24,520
- Target 1: 24,430 (1:1.5 R/R)
- Target 2: 24,400 (1:2.5 R/R)
Swing Consideration: Monitor for breakout preparation above 24,500
Tuesday, September 3, 2025
Market Environment: Increased activity expected, potential trending day
Primary Strategy: Momentum trading with breakout preparation
Key Focus: Volume analysis for sustained directional moves
Trading Scenarios:
Bullish Breakout: Above 24,520 with volume
- Entry: 24,530-24,550
- Stop: 24,480
- Targets: 24,600, 24,650, 24,700
Bearish Breakdown: Below 24,360 with volume
- Entry: 24,350-24,330
- Stop: 24,390
- Targets: 24,280, 24,250, 24,200
Risk Management: Reduce position size by 25% on breakout trades
Wednesday, September 4, 2025
Market Environment: Mid-week volatility, economic data focus
Primary Strategy: News-driven trading with technical confirmation
Event Risk: Monitor for any economic announcements
Scalping Strategy:
High-Frequency Range: 24,400-24,460
Long Scalps: 24,405-24,415, Target: 24,445-24,455
Short Scalps: 24,450-24,460, Target: 24,415-24,425
Stop Loss: Maximum 20 points for scalp trades
Swing Setup: Prepare for potential triangle breakout
Thursday, September 5, 2025
Market Environment: Potential high-volatility day
Primary Strategy: Breakout trading with strong risk management
Focus: Triangle resolution expected
Triangle Breakout Strategy:
Upside Breakout: Above 24,580
- Confirmation: Volume > 1.3x average
- Initial Target: 24,700
- Extended Target: 24,850-24,900
Downside Breakdown: Below 24,280
- Confirmation: Volume > 1.2x average
- Initial Target: 24,150
- Extended Target: 24,000-24,050
Position Management: Trail stops after 50% of target achieved
Friday, September 6, 2025
Market Environment: Weekly settlement, profit-taking likely
Primary Strategy: End-of-week positioning and profit-taking
Focus: Weekly close levels for next week setup
Settlement Strategy:
Bullish Close: Above 24,500 supports next week advance
Neutral Close: 24,350-24,500 maintains consolidation
Bearish Close: Below 24,350 suggests correction risk
Day Trading Approach:
Morning: Follow Thursday's direction initially
Afternoon: Expect consolidation and position adjustments
Last Hour: Avoid large new positions
Risk Management Framework
Position Sizing Guidelines
Risk Per Trade by Timeframe:
5M Scalping: 0.25-0.5% of capital
15M Scalping: 0.5-0.75% of capital
1H Day Trading: 1-1.5% of capital
4H Swing Trading: 1.5-2% of capital
Daily Position Trading: 2-2.5% of capital
Stop Loss Framework
Timeframe-Specific Stops:
5-Minute: 15-25 points maximum
15-Minute: 25-40 points maximum
1-Hour: 40-60 points maximum
4-Hour: 80-120 points maximum
Daily: 150-250 points maximum
Profit-Taking Strategy
Systematic Approach:
Target 1 (40%): 1:1 Risk/Reward
Target 2 (35%): 1:2 Risk/Reward
Target 3 (25%): 1:3+ Risk/Reward
Trailing Stops: Activate after Target 1
Maximum Drawdown Limits
Daily Loss Limit: 3% of trading capital
Weekly Loss Limit: 7% of trading capital
Monthly Loss Limit: 15% of trading capital
Geopolitical and Economic Risk Assessment
Domestic Risk Factors
Monetary Policy:
- RBI rate cut cycle supporting liquidity
- Inflation targeting maintaining credibility
- Banking system stability considerations
Fiscal Policy:
- Government capex supporting growth
- Festive season spending boost expected
- Budget allocation efficiency focus
Corporate Earnings:
- Q2 FY26 earnings season approaching
- Margin pressure from input costs
- Sectoral rotation opportunities
Global Risk Factors
US Federal Reserve Policy:
- Rate cut expectations supporting EM flows
- Dollar weakness benefiting Indian markets
- Global liquidity conditions favorable
China Economic Impact:
- Trade relationship developments
- Commodity price implications
- Regional growth spillover effects
Geopolitical Considerations:
- Regional security stability
- Energy security and pricing
- Trade policy developments
Sector-Specific Risks
Banking & Financial Services:
- Credit growth sustainability
- NPA cycle management
- Interest rate sensitivity
Information Technology:
- Global demand patterns
- Currency hedging strategies
- AI and automation impact
Consumer Discretionary:
- Rural demand recovery
- Festive season performance
- Inflation impact on spending
Sectoral Analysis and Rotation Themes
Outperforming Sectors
1. Banking & Financial Services: Rate cut cycle benefits
2. FMCG: Festive season demand and rural recovery
3. Infrastructure: Government capex and policy support
4. Pharmaceuticals: Export competitiveness and domestic growth
Underperforming Sectors
1. Information Technology: Global demand concerns
2. Metals & Mining: Commodity price volatility
3. Real Estate: Interest rate sensitivity despite cuts
4. Telecommunications: Competitive pressure and capex burden
Rotation Indicators
Growth vs Value: Favoring quality growth at reasonable prices
Large Cap vs Mid/Small Cap: Large cap leadership maintained
Domestic vs Export: Domestic consumption themes outperforming
Advanced Technical Patterns
Ichimoku Trading Signals
Current Setup: Price within cloud, neutral bias
Bullish Trigger: Break above Tenkan-sen with volume
Bearish Trigger: Break below cloud with momentum
Long-term View: Future cloud remains bullish
Gann-Based Strategies
Square of 9 Trades:
- Long: 155° (24,025) targeting 158° (24,964)
- Short: 158° (24,964) targeting 155° (24,025)
- Time Cycles: September 9-12 reversal window
Wyckoff Phase Trading
Current Phase: Accumulation Phase C
Next Phase: Markup expected on successful test
Volume Confirmation: Key for phase transition
Distribution Risk: Monitor above 25,200
Market Microstructure Analysis
Algorithmic Trading Impact
High-Activity Zones: 24,000, 24,500, 25,000 levels
Optimal Entry Times: 9:15-9:45 and 14:30-15:15 IST
Liquidity Patterns: Reduced depth during lunch hours
Order Flow Considerations
Institutional Activity: Accumulation evident below 24,400
FII Flows: Recent buying supporting current levels
DII Participation: Consistent buying on weakness
Technology and Tools Integration
Recommended Platforms
1. TradingView: Advanced charting and technical analysis
2. Zerodha Kite: Real-time execution and portfolio management
3. Bloomberg Terminal: Comprehensive market data and news
4. Refinitiv Workspace: Fundamental analysis integration
Alert Configuration
Price Alerts:
- Triangle breakout: 24,580 (up) / 24,280 (down)
- Psychological levels: 24,500, 25,000
- Support/resistance: 24,200, 24,700
Volume Alerts:
- Unusual volume spikes (>150% average)
- Block deal notifications
- Institutional flow changes
Seasonal and Calendar Considerations
Festive Season Impact
Indian markets are entering the 4-month-long festive season from September, which historically shows positive performance. This period typically sees:
- Increased consumer spending
- Corporate bonus distributions
- Portfolio rebalancing by institutions
- Higher retail participation
Economic Calendar
Key Events:
- RBI Monetary Policy (likely September 17)
- Q2 FY26 GDP data (October/November)
- Inflation data (monthly releases)
- FII/DII flow data (weekly)
Holiday Calendar
- Ganesh Chaturthi (September 7) - Market closed
- Dussehra (October 12) - Market closed
- Diwali (November 1) - Market closed
- Guru Nanak Jayanti (November 15) - Market closed
Conclusion and Strategic Outlook
The NIFTY 50 stands at a critical juncture, consolidating near significant resistance levels while benefiting from supportive monetary and fiscal policies. The technical picture suggests a healthy consolidation phase that could resolve in favor of further upside, particularly given the approaching festive season and improving economic fundamentals.
Key Investment Themes:
1. Triangle Resolution: Current consolidation likely to resolve with directional clarity
2. Festive Season Tailwinds: Historical patterns favor bullish bias into year-end
3. Rate Cut Benefits: Lower rates supporting equity valuations and credit growth
4. Earnings Growth: Expected double-digit growth supporting index advancement
Trading Strategy Priorities:
- Focus on triangle breakout trades with volume confirmation
- Favor range trading until clear directional break
- Maintain disciplined risk management given elevated levels
- Prepare for increased volatility around key events
Medium-term Outlook (1-3 months):
The combination of accommodative monetary policy, strong GDP growth, controlled inflation, and seasonal tailwinds provides a constructive backdrop for Indian equities. Technical analysis suggests potential for advancement toward 25,500-26,000 on sustained breakout above current resistance.
Risk Management Focus:
- Triangle breakdown below 24,280 could target 24,000-23,800
- Global risk-off sentiment remains key external risk
- Valuation concerns at higher levels warrant selectivity
- Currency stability important for FII flow continuation
The analysis incorporates multiple technical methodologies while acknowledging the strong fundamental backdrop supporting Indian markets. Traders should remain flexible and prepared for both continuation and reversal scenarios while maintaining strict adherence to risk management protocols.
---
*This comprehensive analysis combines technical and fundamental factors to provide actionable trading strategies. All recommendations should be implemented within individual risk tolerance parameters and current market conditions. Market dynamics can change rapidly, requiring continuous monitoring and strategy adjustments.*
NIFTY 50 rally to start in wave C up The chart of the nifty 50 is ending wave B low we should now see a nice clean 5 waves up to form a Flat before The CRASH in 2025 the year of the BEAR


India's Nifty 50: A Rising Star in a Geopolitical StormIn 2023, the Indian stock market, represented by the Nifty 50 index, has emerged as a standout performer. Outpacing its U.S. counterpart, the S&P 500, by a significant margin, the Nifty 50 has captured the attention of global investors. Several factors converge to explain this impressive performance, with geopolitical tensions playing a pivotal role.
The Great Manufacturing Shift: India as a Prime Beneficiary
One of the most compelling narratives driving India's economic ascent is the global shift in manufacturing. As the world grapples with heightened geopolitical risks, particularly the escalating tensions between the United States and China, businesses are seeking to diversify their supply chains. India, with its vast market, skilled workforce, and government's "Make in India" initiative, has emerged as a compelling alternative to China for many multinational corporations.
Diversification of Supply Chains: Companies like Apple and Google are actively exploring manufacturing operations in India to reduce their reliance on China. This trend extends to various sectors, including pharmaceuticals, automobiles, and textiles.
Government Support: India's government has proactively created a conducive business environment through infrastructure development, tax incentives, and ease of doing business reforms. These efforts have boosted investor confidence and accelerated the country's industrialization process.
India's Economic Characteristics and Domestic Consumption
India's strong domestic consumption and the rise in manufacturing are major factors in the country's economic expansion. The demand for goods and services is increasing due to the growing middle class and increased disposable incomes. The approach of consumption-led growth enhances the resilience of the Indian economy by acting as a buffer against external shocks.
India's economy boasts several key characteristics:
Rapid Growth: India has consistently been one of the fastest-growing major economies globally.
Large Domestic Market: With a population of over 1.4 billion, India offers a vast consumer base, driving domestic consumption.
Young Population: A large and young workforce provides a demographic dividend, fueling economic potential.
IT and Services Dominance: The IT and services sector is a major contributor to India's GDP, with companies excelling in software development, outsourcing, and business process management.
Agricultural Importance: Agriculture remains a crucial sector, employing a significant portion of the population, although its contribution to GDP is declining.
Challenges and Opportunities
While India's economic trajectory is promising, it faces challenges such as:
Infrastructure Gaps: Improving infrastructure, including transportation, energy, and digital connectivity, is essential for sustained growth.
Poverty and Inequality: Addressing poverty and reducing income inequality remains a priority.
Education and Skill Development: Investing in education and skill development is crucial to enhancing human capital.
Environmental Concerns: One of the main challenges is balancing environmental sustainability with economic growth.
Despite these challenges, India offers immense opportunities for businesses and investors:
Large Consumer Market: The growing middle class presents a lucrative market for consumer goods and services.
Favorable Government Policies: The government's focus on economic reforms and ease of doing business creates a conducive environment for investment.
Digital Transformation: India's rapid adoption of digital technologies presents opportunities in e-commerce, fintech, and digital payments.
The Road Ahead
While the Nifty 50's performance has been impressive, challenges remain. Inflationary pressures, global economic uncertainties, and the potential impact of a prolonged geopolitical standoff could pose risks. However, India's demographic dividend, its digital transformation, and its focus on renewable energy offer promising avenues for long-term growth. Continued focus on infrastructure, education, and skill development will be crucial for realizing its full potential.
In today's complex geopolitical environment, India seems well-placed to take advantage of the opportunities arising from global supply chain disruptions. The performance of the Nifty 50 index reflects India's increasing economic influence and its potential to emerge as a global manufacturing and consumption hub.

NIFTY 50 AND NIFTY 50 STOCKS PREDICTION FOR 21/4/2017NIFTY 50 AND NIFTY 50 STOCKS PREDICTION FOR 21/4/2017 :BE=BUY ENTRY SE=SELL ENTRY
nifty-pricerange.blogspot.in

Nifty 50 (+0.51%) Bank Nifty (+0.50%)
Nifty 50 (+0.51%) Bank Nifty (+0.50%)
Nifty 50 ✔️
After a flat start, the Nifty climbed on January 1st. At the closing, the Nifty was up 0.51%, or 92.2 points, to 18197.5.
On the 15-minute time frame, the Nifty has been spotted in an ascending triangle pattern, and it has also been consolidating on the 50-day moving average.
Technically, we can expect a strong move over 18300.
Breaking over 18300 will lead to 18480, while breaking below 17950 will lead to 17820.
Bank Nifty 50 ✔️
Due to outstanding performances by ICICI and Axis banks, the Bank Nifty closed up 216.65 points (+0.5%).
On the 15-minute time frame, Bank Nifty was observed in an ascending channel pattern, and it was also observed consolidating on the 50-day moving average.
Technically, we can expect a strong rally over 43650
Breaking over 43650 will lead to 44100, while breaking below 42900 will lead to 42600.
Rupee had a significant decline despite a reasonable gain in market indexes.

NIFTY 50 Trade Setup 20 FEB EXPIRY -- Education purpose only--Nifty 50 Faces Key Support At 22,800 Levels
open interest distribution for the Nifty 50 Feb. 20 expiry series indicated most activity at 23,500 call strikes, with the 23,000 put strikes having maximum open interest.
Nifty 50 support is placed at 22,800. "If Nifty 50 falls below 22800, then the selling will trigger. Nifty 50 immediate resistance at 23,000,"
19th Feb Target 1 22687.08

Nifty 50 Technical Analysis - 4th April 2024 Santu SahaNifty 50 Technical Analysis - 4th April 2024
## Market Overview
Nifty 50 is exhibiting key support and resistance levels, providing potential trading insights for tomorrow's session.
### Support Levels
**1. Support Levels:**
- **22,400:** Initial support level for Nifty 50. If the market opens above this level, it may act as support.
### Resistance Levels
**1. Resistance Levels:**
- **22,520:** Current resistance level for Nifty 50. A breakout above this level could signal an upside movement.
### Technical Insights
#### Support Analysis
Nifty 50 is expected to find support at 22,400, with this level potentially acting as a support if the market opens above it. Traders should monitor price action around this level for potential entry opportunities.
#### Resistance Analysis
The current resistance level for Nifty 50 is at 22,520. A decisive breakout above this level could indicate further upside potential in the market. Traders should watch for confirmation of a breakout before considering bullish positions.
### Trading Recommendation
Traders are advised to exercise caution and wait for confirmation before initiating new positions. A breakout above 22,520 or breakdown below 22,400 could present trading opportunities. It's essential to implement proper risk management strategies to mitigate potential losses.
### Disclaimer: Risk Management
Trading involves inherent risks, and traders should conduct thorough analysis and adhere to strict risk management protocols to safeguard their capital.

Nifty 50 │ 30-11-2021Nifty-50 Is on Bullish Trend
Date:- 30-11-2021
Bullish :- Buy Trade { Positive } Pattern :- V
Nifty-50 Movement :- ( 127 ~ ) Points
Nifty-50 { 3:30 PM } T.C.A :- ( 16904~ )
STOP-LOSS :- Uses Your Own Stop-Loss
Quantum Physics Researcher :- Jeevan Singh
Nifty-50 Closing Created Using With HPC ( High performance Computing )
Guys This is R&D ( Research And Development ) Purpose Only.
I am Not Responsible If your Stop-Loss Hit And! I am Also Not Responsible If Regulator Call Me Manipulator.
Thank You For Making Trust And Don't Forget To Support Me!

Nifty 50 Index (1H) – Critical Support and Trading Plan#Nifty 50 Index (1H)
The Nifty 50 Index has entered a crucial juncture on the 1-hour timeframe, and we are witnessing price action testing the major support zone between 24,400 and 24,700. Let’s break down what we are seeing and potential scenarios moving forward:
Key Observations:
1. Support Zone:
The price is currently hovering around a well-established support zone. Historically, this area between 24,400 and 24,700 has acted as a demand zone, where buyers have stepped in to push the price higher.
However, we are seeing some bearish pressure leading into this zone, as evidenced by the consecutive red candles leading to this level. A failure to hold here could lead to more downside movement.
2. RSI Indicator:
The RSI (Relative Strength Index) is currently sitting around 35.71, close to the oversold region.
Historically, whenever RSI approaches this zone, we often witness a reversal or bounce, especially if the price aligns with key support levels like the one we are currently at.
If RSI dips further and enters the oversold territory (below 30), it could signify an extended bearish move before a potential reversal.
3. Volume Analysis:
The Volume MA shows significant trading activity in this region, which indicates traders are positioning for the next move, either a bounce or a break.
Rising volume during a retest of support typically suggests there is strong interest from both buyers and sellers, and could result in a volatile move soon.
Potential Trade Scenarios:
1. Bullish Scenario:
If Nifty 50 manages to hold above the 24,400 level and shows signs of strength (like bullish candlestick patterns or an increase in buying volume), we could see a reversal.
Upside targets:
Initial target: 24,700 (upper bound of the current range).
Next potential target: 25,000+ if momentum builds beyond the immediate resistance.
2. Bearish Scenario:
On the other hand, if the price breaks below 24,400 and closes decisively below this support zone (especially on higher timeframes like the 1H or 4H chart), it could open the door for further downside.
Downside targets:
Immediate target: 24,100, where the next major support lies.
Further downside: If bearish pressure intensifies, the market may see a drop toward 23,800, which aligns with previous lower lows on the chart.
Trading Plan:
For Long Trades:
Watch for bullish confirmation (like hammer/reversal candles) near 24,400. A successful hold of this zone could trigger a long entry, with a tight stop-loss placed slightly below 24,350.
Take-profit targets:
First exit at 24,700.
Extended target toward 25,000.
For Short Trades:
A break and close below 24,400 with high volume might signal a short entry opportunity.
Set a stop-loss around 24,550 to avoid fakeouts.
Target zones:
First target at 24,100.
Lower target at 23,800 for extended profits.
---
In Summary: The Nifty 50 is sitting at a make-or-break level. The reaction in this support zone will likely define the market's direction for the near term. Traders should be cautious, waiting for confirmation signals before committing to either direction. Keep an eye on volume spikes and RSI movements for additional clues.
---
#Nifty50 #TechnicalAnalysis #StockTrading #SupportAndResistance #PriceAction #RSI #VolumeAnalysis #TradingStrategy #BreakoutOrBounce #IndianMarket #NSE #StockMarket #BullsAndBears

Nifty 50 Support and Resistance Levels for July 22, 2024Nifty 50 Support and Resistance Levels for July 22, 2024
Support Levels:
- 24400: This is a critical support level. If the market breaks below this level, it may indicate further downside potential.
- 24300: If 24400 is breached, watch for potential support around 24300. A bounce from this level could signal a temporary reversal.
Resistance Levels:
- 24500: If the market opens below this level, it will act as the first resistance. Nifty needs to sustain above 24500 for any bullish momentum.
- 24650: This is a significant resistance level. If Nifty manages to break above 24650 decisively, it could indicate a continuation of the uptrend.
Market Analysis:
- Bearish Scenario: If Nifty opens below 24500, expect initial resistance around 24500. Further resistance could be encountered near 24600. Downside support lies at 24400 and 24300.
- Bullish Scenario: A gap-up opening could face resistance at 24650. To sustain a bullish momentum, Nifty must hold above 24500. Support levels to watch are 24400 and 24300 in case of a pullback.
Trading Strategy:
- Long Positions: Consider long positions if Nifty breaks and holds above 24500, targeting 24650 with a stop-loss below 24400.
- Short Positions: Short trades could be initiated if Nifty fails to sustain above 24500, targeting 24400 initially, with further downside potential towards 24300.
Conclusion:
- Nifty 50 is currently at a pivotal juncture with key support at 24400 and resistance at 24500 and 24650. Traders should monitor the market's reaction at these levels to determine the next directional move.
This analysis is for informational purposes only and does not constitute financial advice. Traders are advised to conduct their own research and consider their risk tolerance before making any trading decisions.

Nifty 50 Technical Analysis - 27th March 2024 Santu Saha Nifty 50 Technical Analysis - 27th March 2024
## Market Overview
Despite sluggish movement, Nifty 50 exhibits discernible support and resistance levels. Let's delve into the analysis:
### Support Levels
**1. Support: 21,900**
- Present support level for Nifty 50.
- Should the market break below this level, the next support zone is anticipated around 21,732.
### Resistance Zone
**1. Resistance: 22,100**
- Current resistance zone for Nifty 50.
- A sustained trade above this level may signify an impending upside movement in the market.
### Technical Insights
#### Support Zone Analysis
Nifty 50 is currently finding support at the level of 21,900. This level serves as a crucial pivot point, and a breach below it could signal further downside potential, with 21,732 as the subsequent support level.
#### Resistance Zone Analysis
Traders should closely monitor price action around the resistance level of 22,100. A decisive breakthrough above this resistance, accompanied by robust volume, may indicate a shift in market sentiment towards bullishness.
### Trading Recommendation
Given the subdued market movement, traders are advised to exercise caution and wait for confirmation before initiating new positions. A breakout above 22,100 or a breakdown below 21,900 could present viable trading opportunities, but confirmation is paramount.
### Disclaimer: Risk Management
Trading in choppy markets carries inherent risks. Traders should implement robust risk management strategies and adjust their positions accordingly to mitigate potential losses.

Nifty 50 Technical Analysis - 22nd March 2024 Santu Saha Nifty 50 Technical Analysis - 22nd March 2024
## Market Overview
Let's analyze the support and resistance levels for Nifty 50 based on recent market trends.
### Support Levels
**1. Support: 21,900**
- Key support level for Nifty 50.
- If the market breaks below this level again, it may fall further to around 21,700.
- Considered a significant support level.
**2. Support: 21,730**
- Secondary support level.
- If the market faces downward pressure, it could find support around 21,730.
### Resistance Zone
**1. Resistance: 22,100**
- Major resistance level for Nifty 50.
- If the market opens above this level, traders should wait for confirmation. If sustained above, it may signal a potential upside movement.
- Also acts as a resistance level upon retesting.
### Technical Insights
#### Support Zone Analysis
Nifty 50 is currently testing the support level of 21,900. This level is critical for maintaining bullish momentum. A break below may lead to further downside movement, with 21,700 as the next support level.
#### Resistance Zone Analysis
Traders should closely monitor price action around the resistance level of 22,100. A sustained move above this level with strong volume and momentum could indicate a bullish breakout. However, failure to hold above this level might lead to a pullback.
### Trading Recommendation
Traders are advised to observe market behavior around the support and resistance levels before initiating new positions. A breakout above 22,100 or a breakdown below 21,900 may present trading opportunities, but confirmation is essential before taking action.
### Disclaimer: Risk Management
Trading in volatile markets carries inherent risks. Traders should implement effective risk management strategies and adjust their positions accordingly.

Nifty 50 Index – Indicates Structural Bullish ContinuationNifty 50 Index – Cup and Handle Breakout Indicates Structural Bullish Continuation
By Chart Pathik | 2 November 2025
Market Overview
The Nifty 50 has completed a long-term Cup and Handle formation, signaling the potential beginning of a new primary uptrend phase. This pattern has developed over several quarters, indicating strong institutional accumulation at lower levels and a sustained recovery momentum.
After multiple attempts, the index has successfully broken above the 25,700–25,800 neckline zone, marking a major breakout on the higher time frame. Prices are now consolidating just above the breakout point, and a controlled retest between 25,800 and 25,200 would offer an ideal zone for positional accumulation.
Technical Structure and Pattern Logic
The Cup and Handle formation observed here is a classic continuation structure that appears after a prolonged corrective base. The “cup” represents a gradual bottoming process with declining volatility, while the “handle” indicates the final consolidation before breakout.
In this case, the cup base formed near 21,000 levels, and the handle developed as a smaller retracement during mid-2025. The breakout occurred with expanding volume and strong momentum candles, confirming genuine participation and reduced selling pressure.
The neckline breakout zone between 25,700 and 25,800 now acts as a key structural support. As long as Nifty sustains above this region, the larger bullish pattern remains valid and intact.
Breakout Validation and Volume Confirmation
Volume trends have played a crucial role in confirming this breakout. Throughout the handle formation, declining volumes indicated drying supply, followed by a visible increase during the breakout candles — a strong confirmation of renewed buying interest.
Additionally, the recent weekly closes above the neckline reflect acceptance of higher prices rather than a temporary spike. This acceptance is essential for sustaining the pattern and projecting valid higher targets.
Key Levels to Watch
Breakout Point: 25,700 – 25,800
Retest Zone: 25,800 – 25,200
Entry Zone (Post Retest): Around 26,000
Stoploss (Positional): 25,200
Target 1: 28,000 (Round Figure and Historical Projection Resistance)
Target 2: 29,200 (Pattern Target Projection)
The pattern target is derived by measuring the depth of the cup (approximately 3,500 points) and projecting it above the breakout level.
Scenario Analysis
If the index sustains above 26,000:
Momentum is likely to strengthen further toward 28,000 initially, followed by a gradual extension toward the 29,000–29,200 zone. Consolidation above 25,800 will confirm the structural strength of the breakout.
If the index dips below 25,700:
That would indicate a short-term retest or shakeout phase. Any decline toward 25,200 should be treated as an opportunity for accumulation as long as the broader structure remains intact. A decisive close below 25,200 would, however, delay the bullish continuation.
Broader Market Context
The breakout comes at a time when broader macro conditions are stabilizing — global risk sentiment has improved, domestic liquidity remains supportive, and sectoral rotations are favoring cyclical and financial components.
Historically, such higher-timeframe pattern breakouts on Nifty tend to trigger medium-term rallies lasting several months, often backed by improving corporate earnings and positive fund flows.
The long consolidation base from 2023–2025 has provided enough time for valuations to cool and earnings to catch up, setting the stage for the next upward leg.
Market Psychology and Investor Positioning
The Cup and Handle structure represents the psychological transition from skepticism to confidence.
The cup base marks the phase of pessimism and gradual accumulation.
The handle marks cautious optimism and minor profit booking.
The breakout reflects conviction returning to the market, often led by institutional repositioning.
The current setup shows that large participants have been steadily absorbing supply near 25,000–25,500, preparing for the next growth leg.
Outlook
In the short term, the Nifty may continue to consolidate around the breakout region before resuming its upward journey. The medium-term view remains firmly bullish as long as the index holds above 25,200.
Over the coming months, sustaining momentum above 26,000 will likely attract renewed institutional flows, with projected extensions toward 28,000 and 29,200.
Chart Pathik View
Nifty has transitioned from consolidation to expansion, breaking out of a multi-quarter base. The structure is clean, volume-supported, and fundamentally justified.
Retests should be seen as opportunities rather than threats. The risk-to-reward ratio heavily favors positional long traders with patience and clear structure management.
This is not a short-term breakout — it represents the beginning of a larger structural rally phase as the market transitions from a corrective base into an expansionary cycle.
Last Time this pattern was formed and broke-out in the month of February 2017 and pattern ended in the month of July 2018. NSE:NIFTY1!

Nifty 50Nifty 50 Chart Analysis.......29/06/23
Rising wedge pattern formed on Nifty 50 daily chart.
Nifty 50 is trading at its resistance level,
so we will search for short side opportunities here.
Today I am going to share my monthly view here
Nifty Short : 19030 / above Gap up lvl.
Sl - 19250,
Target - 18650 / 18465
Enjoy !

Nifty 50 Updates for next weekNifty 50 Index Analysis – Daily TF
Nifty 50 Index has given a straight run to 18100 levels (making a new swing high) after hitting a low of 15800 (impulse) during March 2nd week and is currently in a correction phase. As we all know every impulse has a correction, a correction for the straight impulse is inevitable and the market always moves in such a manner. A half-bat pattern is formed at important Fibonacci levels of 0.5 and 0.618 retracement at 16900 and 16600 respectively. This range is expected to be a strong demand zone for the Index in the coming weeks. As the market is going to open on Monday after a long gap it is important to keep in mind the important triggers that may set the momentum for the coming weeks.
Nifty 50 Index Analysis – Hourly TF
Having made a slightly bearish view in the larger timeframe, we will now analyze the index in the hourly time frame. As can be clearly seen in the 2 HR charts, the index is making lower lows and facing resistance at the blue trendline, which is holding this downtrend. Any reversal is possible only when an important previous swing (17660) is broken and sustained. We are also in the 3rd phase of the Elliot wave (downside) the ABC pattern will get activated when the 17450 level is broken, indicating more pain during the week. This is very likely considering the fact that SGX Nifty has given a closing of 17300 and we can expect the Index at 17200 levels. Further, with the earnings season kicking off, the Index is likely to be volatile.

NIFTY 50 Short Term AnalysisNifty 50 has broken the major support at 17300, the lower trendline and 50 EMA . PSAR has also turned Bearish . With COVID Mutant Variant spooking the markets, any close below the psychological support of 17000 could further pull the marker down. Nifty can find support near the support zones of 16700/16350/16000/15500/200 EMA and bounce back. Failing to do so can further correction in the index. Plan Your Trades Accordingly.
So as of now we can see weakness in Nifty 50 in the short term.

Nifty 50 trend analysis Nifty 50 trend 📈📉 analysis Nifty 50 trend 📈📉 analysis Nifty 50 trend 📈📉 analysis

Nifty 50:Nifty 50:
As mentioned in our earlier posts Nifty 50 index has come down from 23875 to 23165 in the last 3 days.
The immediate resistance lies @23600-23700, while the support @ 22300.
What's possible next?
Nifty 50 has to come down over the next few days to 200-300 points to continue its possible upward trajectory.
Buy on dip market is on hold until 22300.
Cheers.
Note: As always look for potential value buys.

Nifty 50:Nifty 50:
As mentioned in our earlier posts Nifty 50 index has confirmed its reversal trend through its 1500 points rally over the last 5-7 days.
The immediate resistance lies @23850-23950, while the support @ 22300.
What Next?
Nifty 50 has to come down over the next few days to 22900-23100 to continue its upward trajectory.
From here on its a buy on dip market until 22300 is on hold.
Cheers.
Note: As always look for potential value buys.

Nifty 50 Technical Analysis - 20th February 2024 Nifty 50 Technical Analysis - 20th February 2024
Overview
In today's technical analysis for Nifty 50, we observe significant developments as the market has broken out above previously identified resistance levels, transforming them into potential support levels. Traders are advised to tread cautiously and monitor key support and resistance zones for informed decision-making.
Support Levels
**1. Support Level 1: 22,100**
- A pivotal support level that was once a resistance. If the market sustains above this, it may act as a support zone.
**2. Support Level 2: 21,900**
- Another essential support level. A breach might lead to a further downside movement, possibly towards 21,700.
Resistance Level
**No Defined Resistance Above 22,200**
### Technical Insights
#### Support Levels Analysis
The levels of 22,100 and 21,900 have transformed from resistances into potential support zones. Traders should monitor these levels closely as they might serve as crucial areas for potential reversals or temporary halts in the upward movement.
#### Resistance Level Analysis
As of now, no specific resistance levels are identified above 22,200. Traders should exercise caution as the absence of clear resistance zones can create uncertainty in market movements.
Conclusion
In conclusion, today's analysis highlights the breakthrough in Nifty 50, turning previous resistance levels into potential supports. Traders are advised to proceed with caution, closely observing the identified support levels. It's crucial to implement effective risk management strategies and consider other indicators for a comprehensive analysis.
Please note that market conditions can be highly dynamic, and trading decisions should be made based on a thorough understanding of the current scenario.

Nifty 50 Nifty 50 Chart Analysis.......... 12/06/23
Nifty 50 Long 18465 lvl. ya above 18680 lvl.
Sl - 18450 lvl. / (20 premium)
Target - 18530 / 18600 / 18640 / 18675
======================================
Nifty 50 Sell 18675 lvl. ya 18530 lvl.
Sl - 18700 lvl. / (20 premium)
Target - 18610 / 18560 / 18530 / 18465
K to Cr - SMAIndia
Enjoy !
